
View Builder
Spreadsheet-style analytics for financial data.
View Builder brings spreadsheet-like analysis and visualization into the Atlar platform, helping teams explore and share insights across any financial dataset using pivot tables, filters, and customizable charts.
What Is View Builder?
View Builder simplifies reporting and helps bring your data to life for stakeholders.
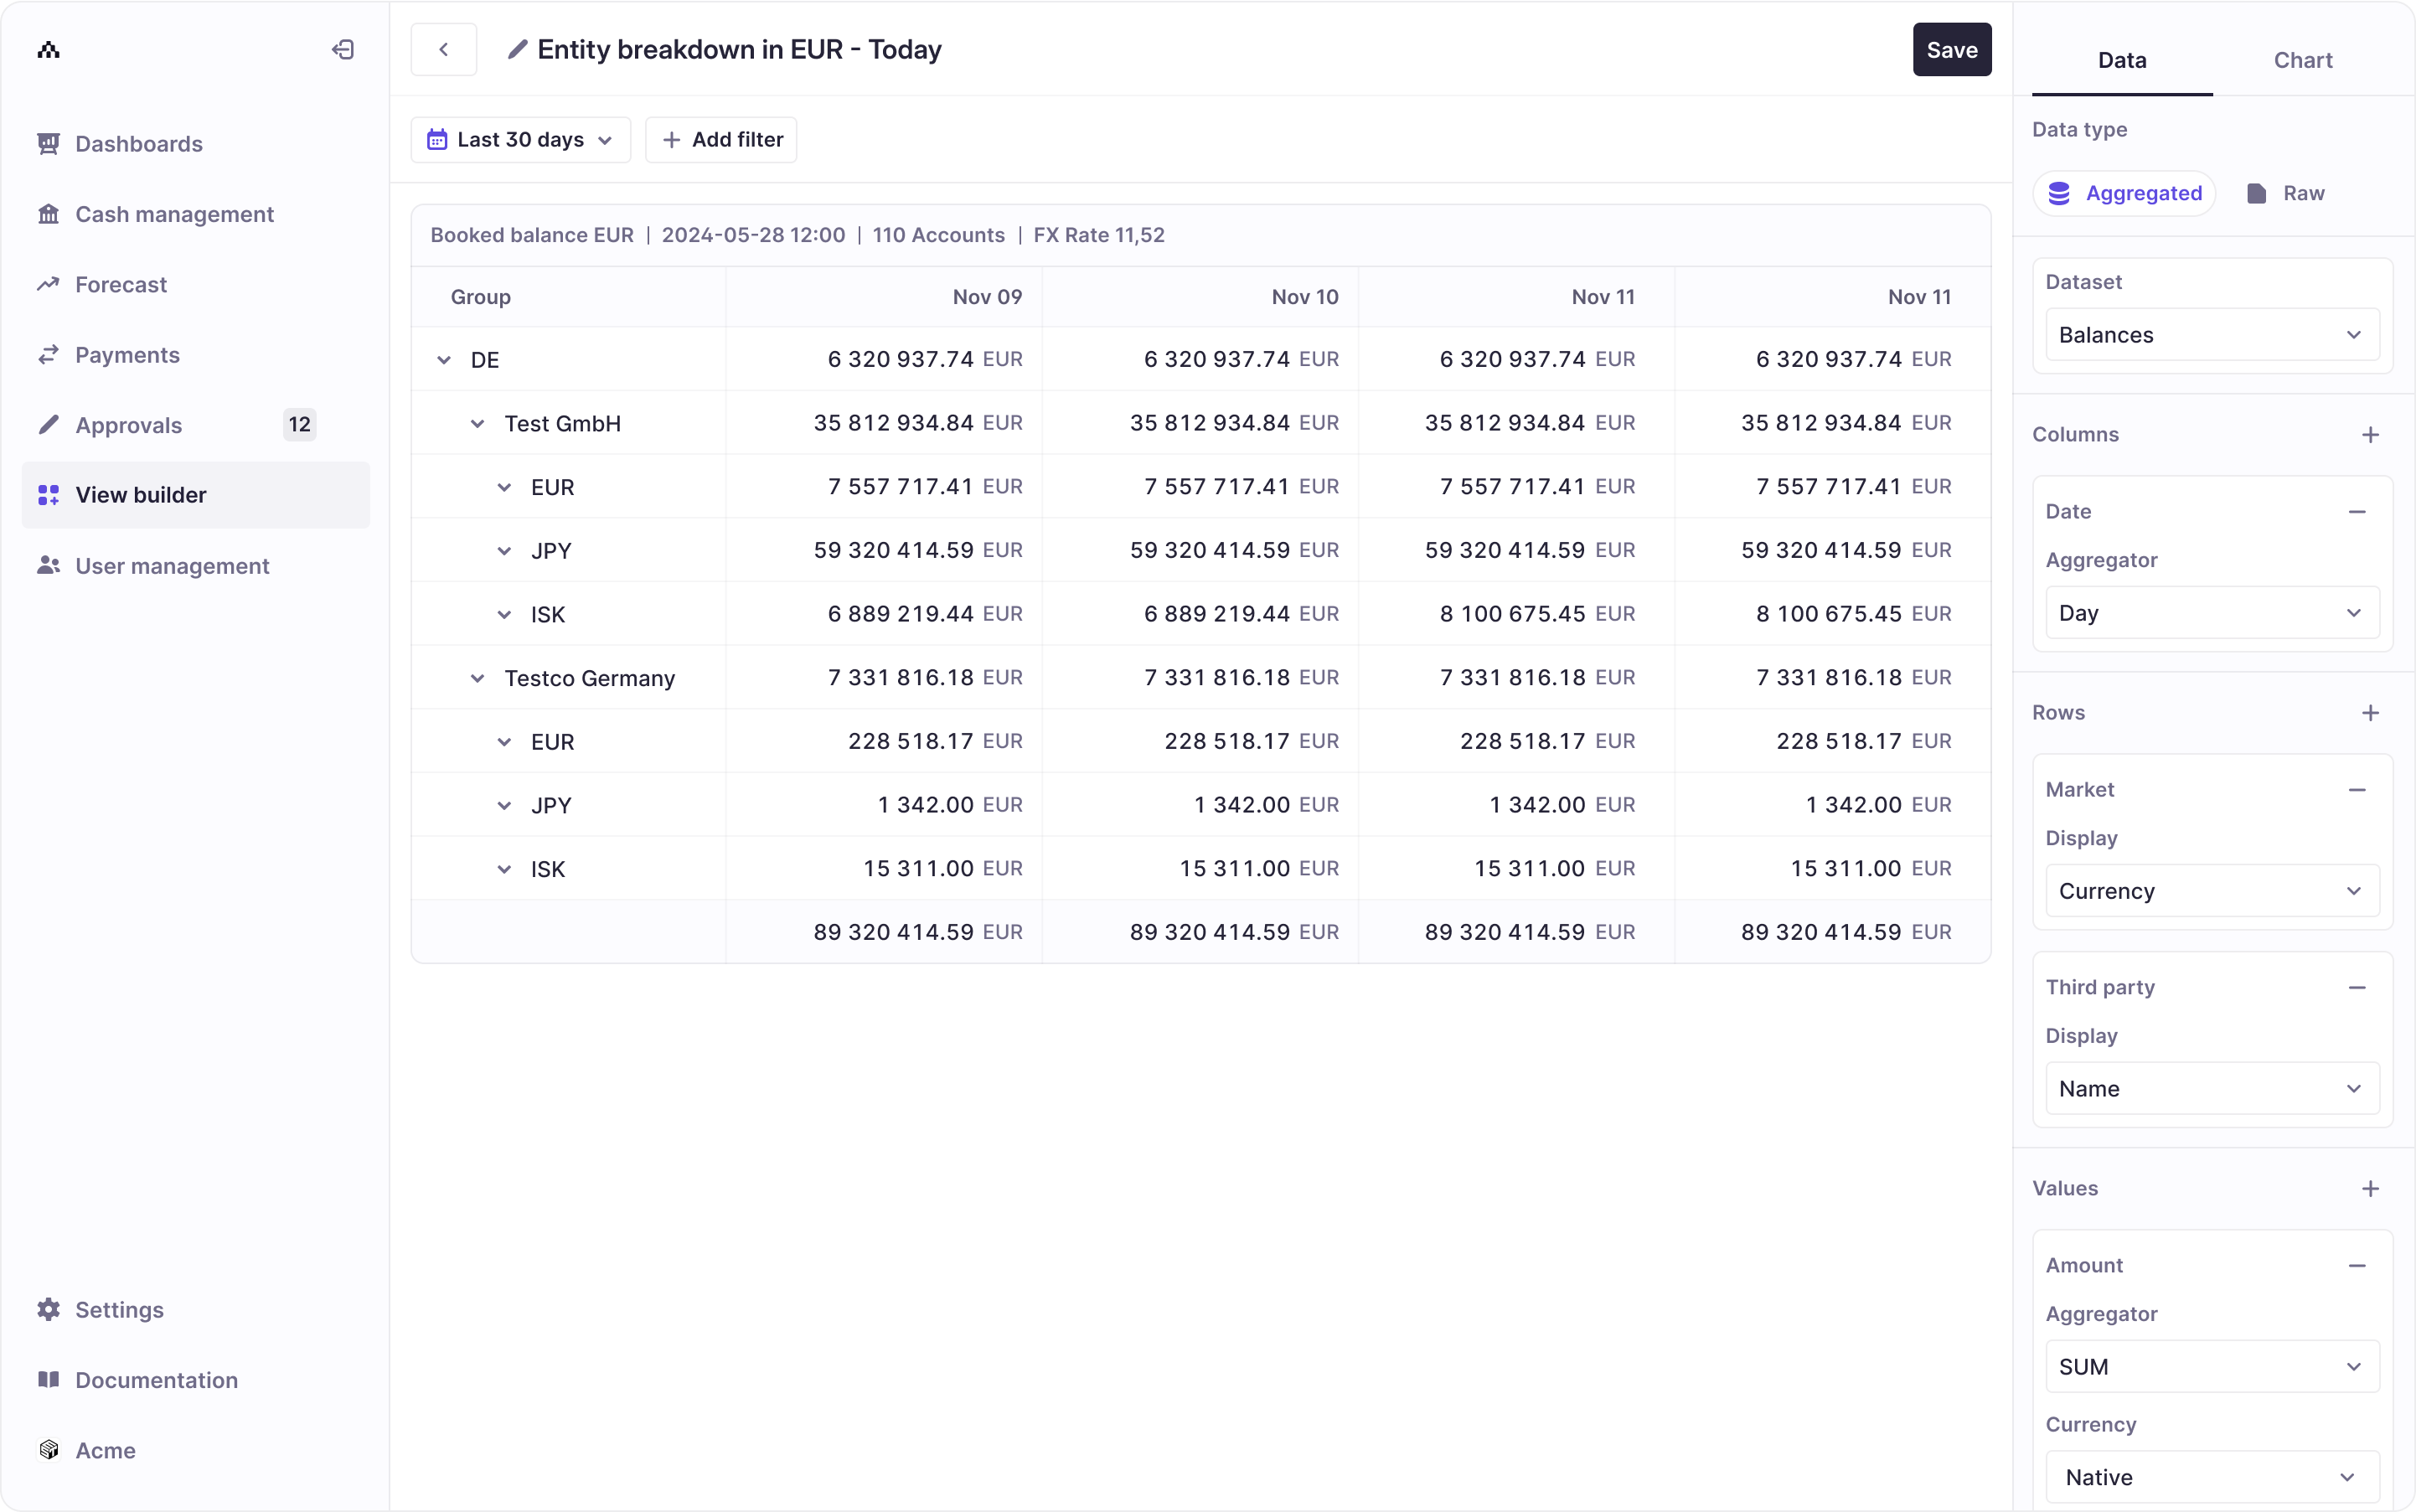
It lets you analyze any aspect of your company’s financial data—such as cash balances, inflows/outflows, payment details, and currencies—using a pivot-table interface with rich chart visualizations.
You can:
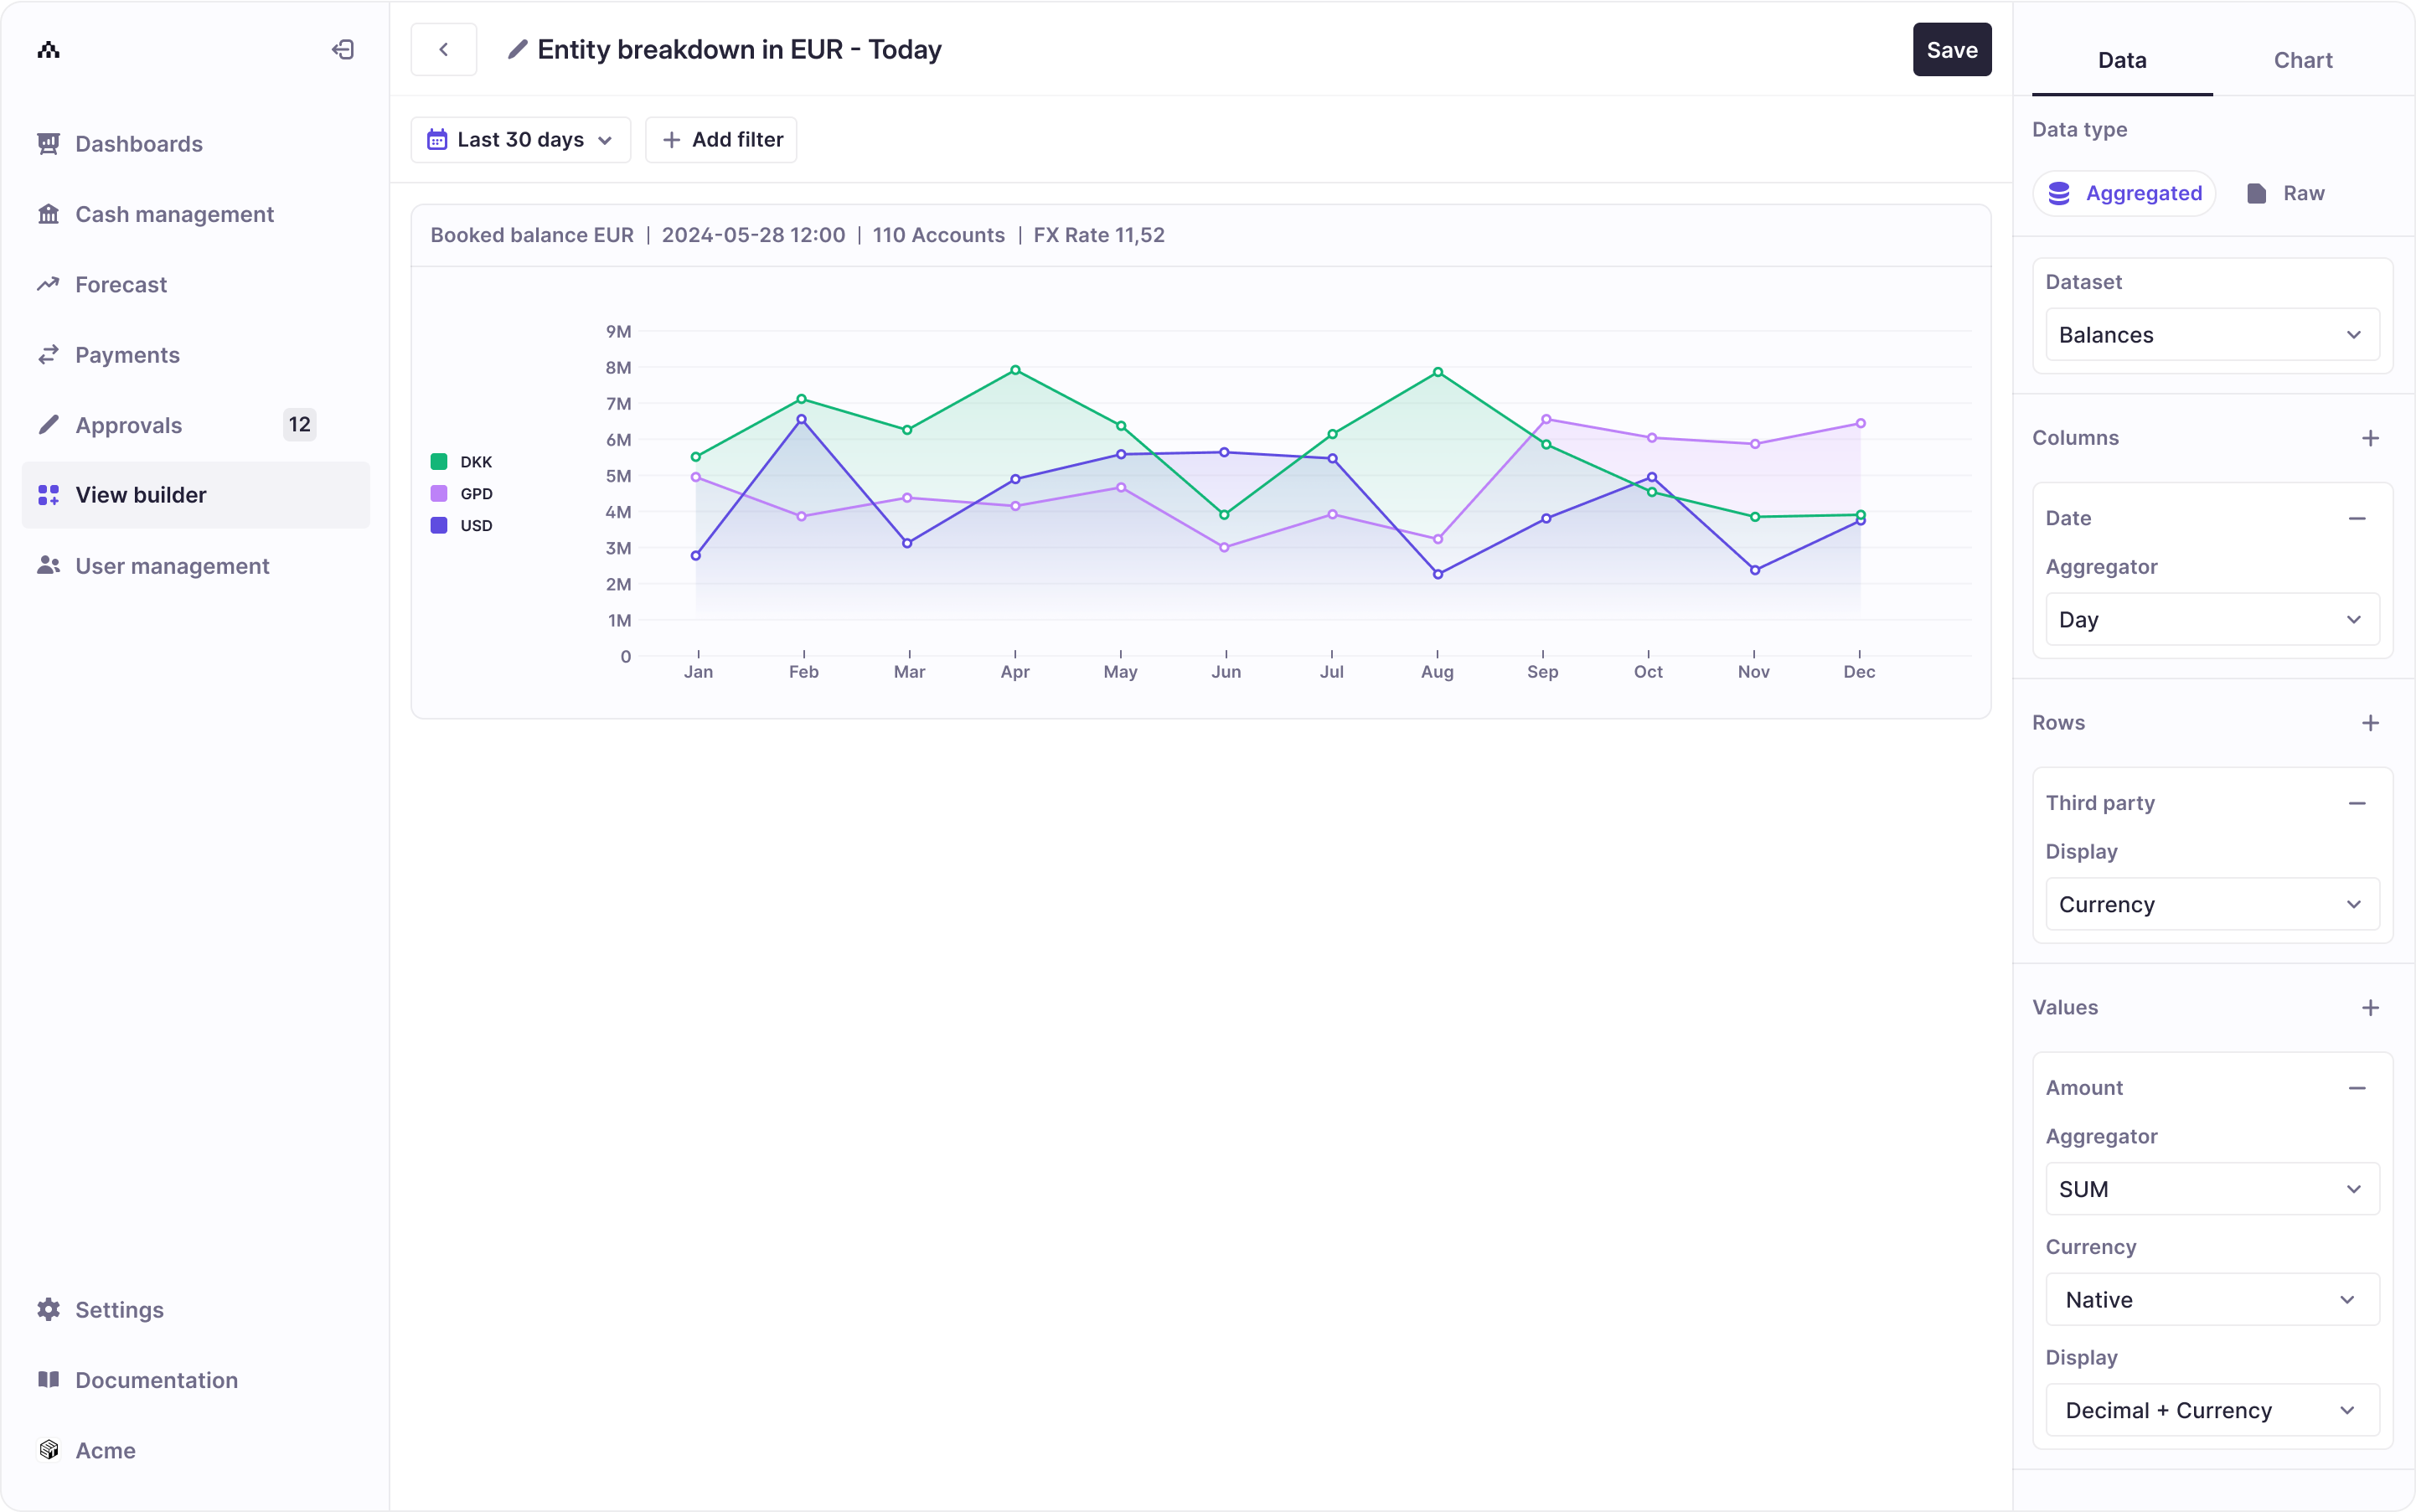
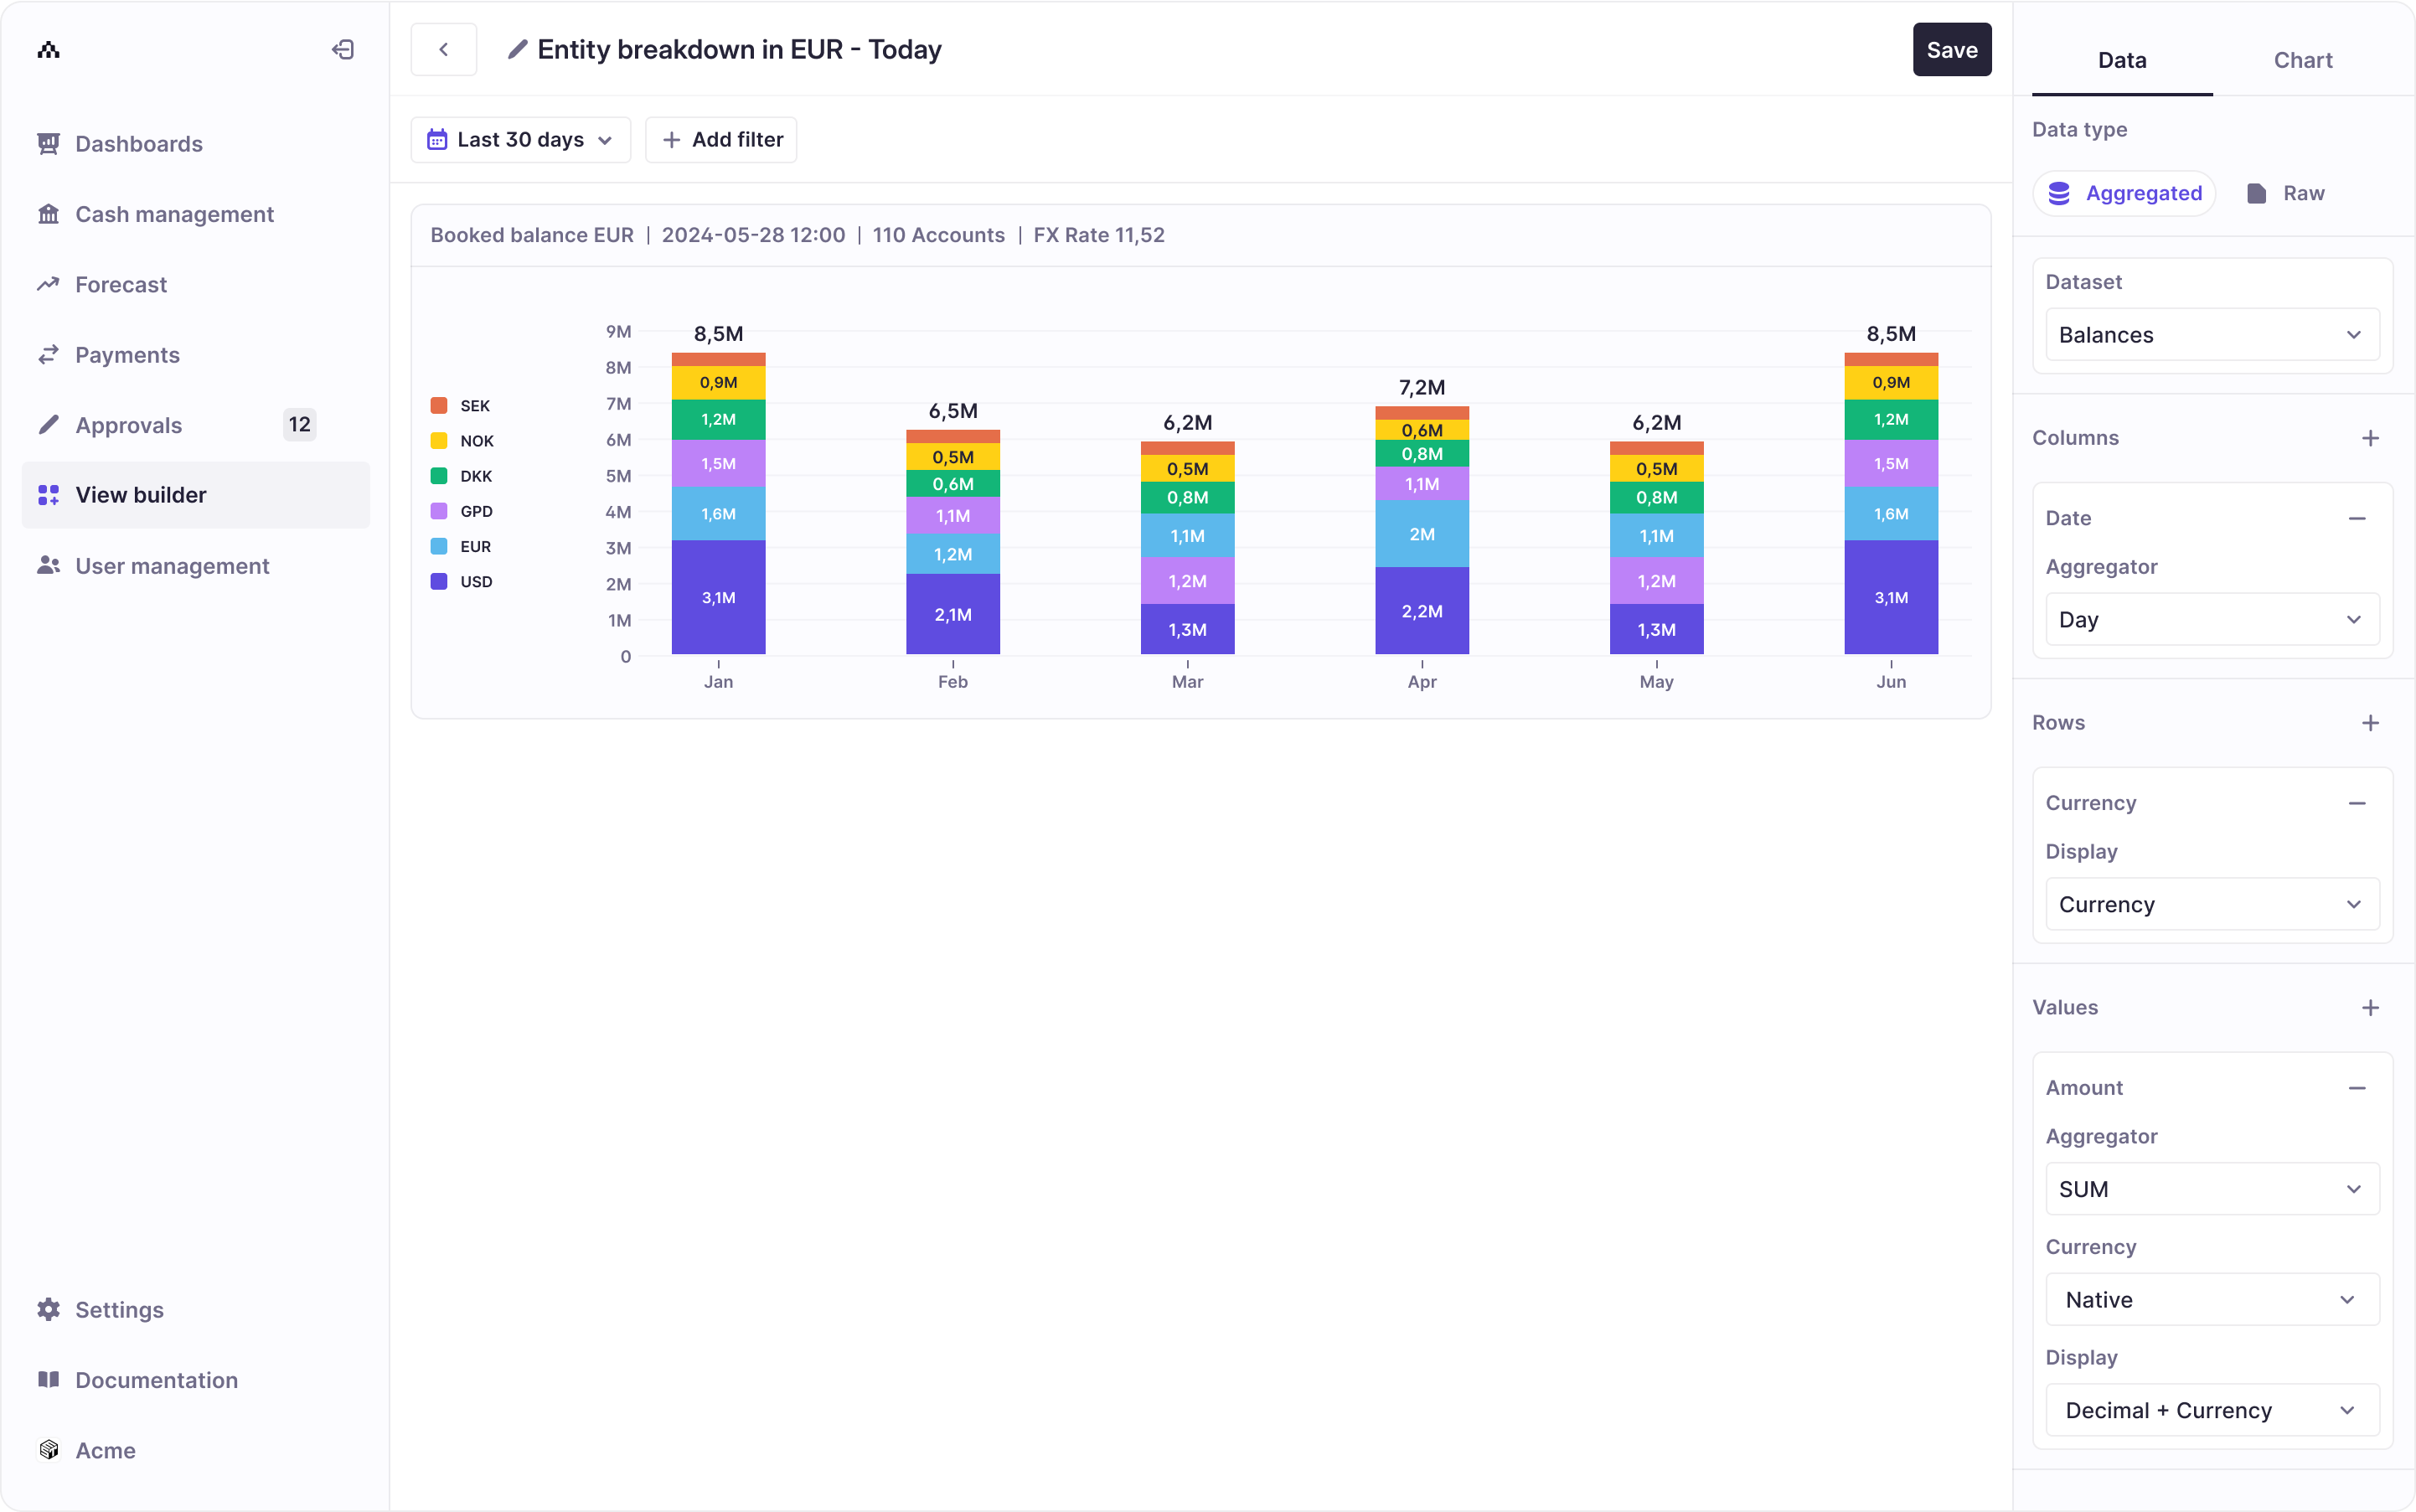
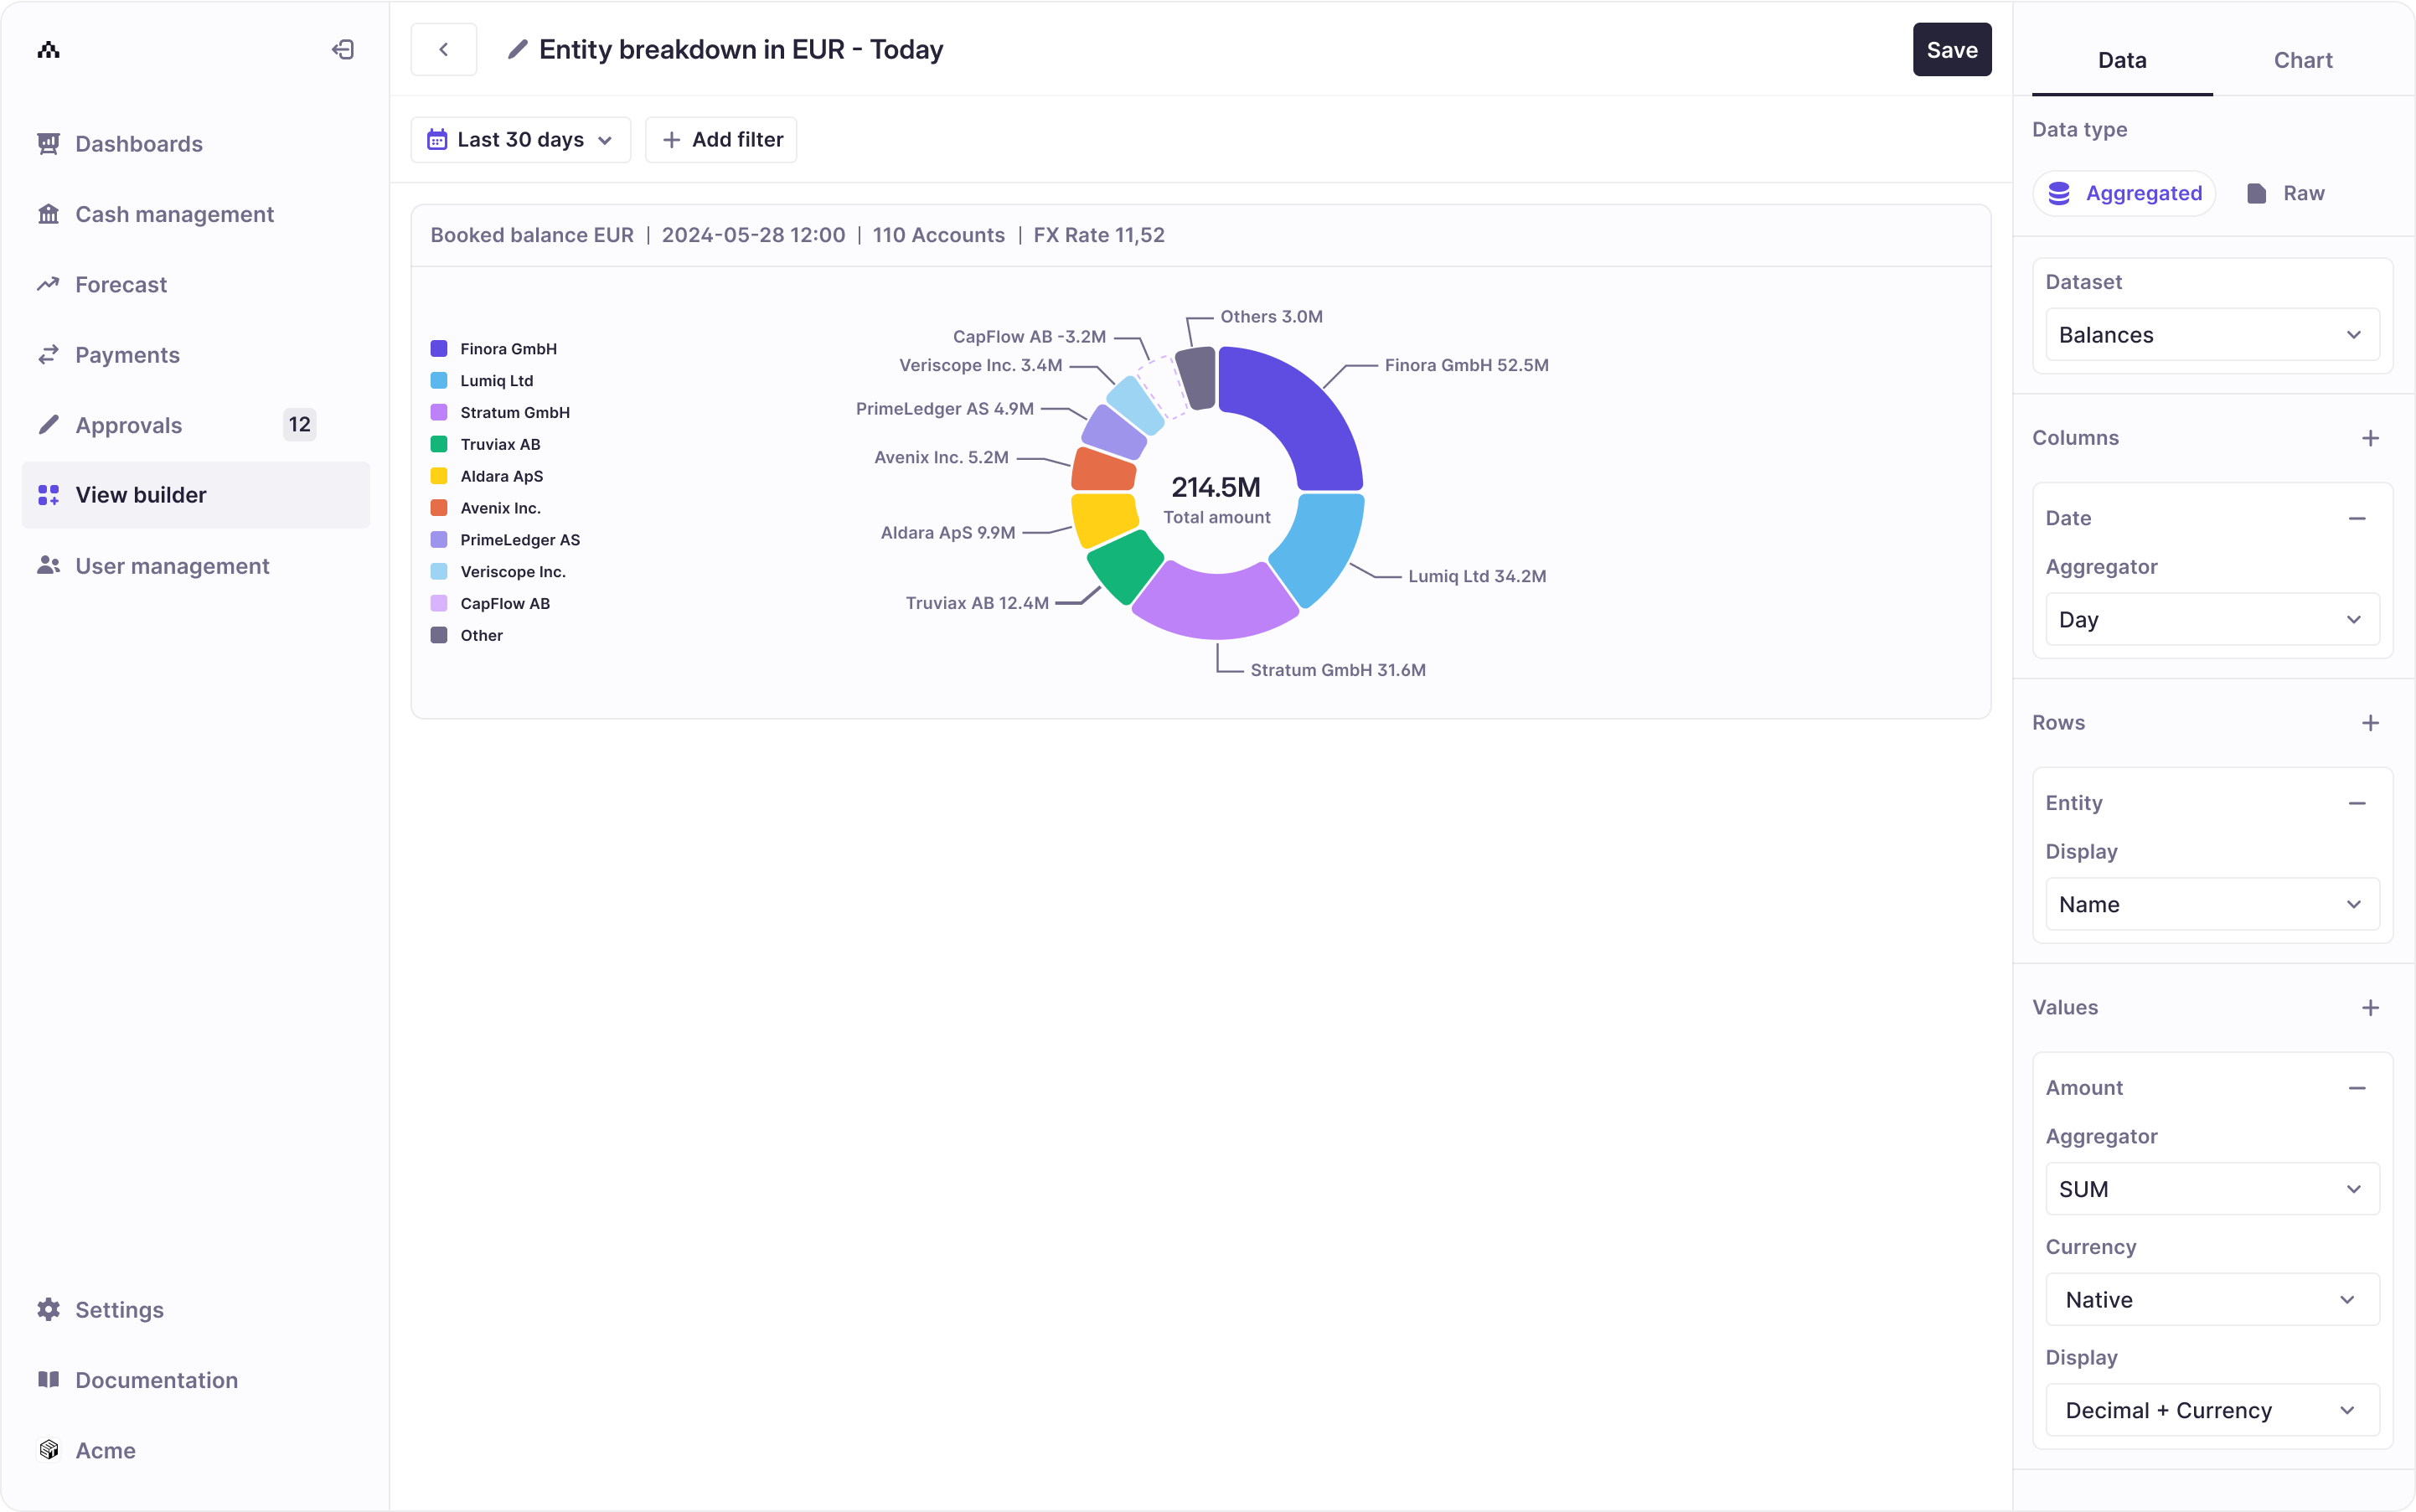
- Save views as a table or chart (bar, line, or pie).
- Pin views to your dashboards for quick access.
- Export views as CSV files (PDF export and automated scheduling coming soon).
If you’re new to dashboards, learn more in the Dashboard documentation.
Key Features
- Excel-style pivot analysis – No exporting or reformatting required.
- Customizable charts – Visualize your data using table, bar, pie, or line charts.
- Smart chart suggestions – Automatic recommendations based on common metrics.
- Advanced filtering – Filter by amount, counterparty, description, currency, account, market, and more.
- Streamlined report creation – Duplicate and tweak existing reports for faster analysis.
- Up-to-date insights – Update saved views to track trends and identify deviations.
How It Works
To get started:
- Go to the View Builder tab and click Create View or select a suggested report.
- Select the dataset you want to analyze.
- Choose the values to display (e.g., amount, count, FX rate) and select a time range.
- Apply filters to focus on specific data (entity, market, or third party).
- Select your preferred chart type:
- Table
- Bar chart
- Pie chart
- Line chart
- Save your view, pin it to a dashboard, or export it.
Tip: Use Account Groups for Better Filtering
Create custom filters under Settings → Accounts and Entities → Account Groups.
For example, group accounts by fund type (restricted vs. unrestricted) or account type (investment, operational, reserve) to tailor your views and dashboards.
Example Views
Below are example visualizations you can create and add to a dashboard.
To learn how to pin a saved view as a dashboard widget, see the Dashboard documentation.
Updated 10 months ago